Some Calc recipes
See also The GNU Calc Reference
Card.
Quickly graphing data
A single set of ordinates
Say we have two columns of data in a GNU Emacs buffer, and we want
to plot them as abscissae and ordinates; e.g.
      0.01   20.0
      0.02   0.00
      0.03   9.97
      0.04   0.15
      0.05   7.06
      0.06   0.90
      0.07   4.90
      0.08   1.68
- Select the rectangle: with the cursor at the top-left, hit C-SPC
to
set-mark-command then move cursor to the bottom-right.
- Then
M-# r to calc-dispatch and
‘grab rectangle from a buffer’.
- In Calc, hit
v t to calc-transpose, then
v u to calc-unpack the data into two row
vectors.
- Finally hit
g f to calc-graph-fast.
This should produce something like the following graph.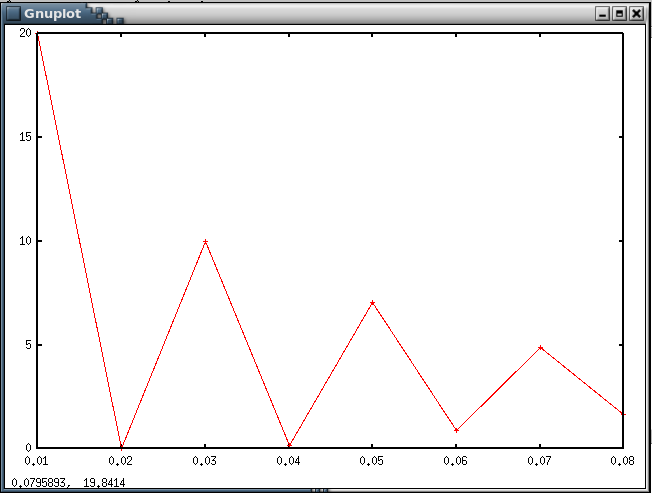
If you want a grid, issue g g
(calc-graph-grid) and g p
(calc-graph-plot).
Using an integer sequence as abscissae
To graph equally spaced ordinates, the abscissae aren't
required: just put 0 or 1 in the second position on the GNU Calc
stack before issuing calc-graph-fast.
Multiple sets of ordinates
Say we have a second set of ordinates in a third column; e.g.
      0.01   20.00   8.98
      0.02   0.00    6.64
      0.03   9.97    5.60
      0.04   0.15    4.99
      0.05   7.06    4.56
      0.06   0.90    4.25
      0.07   4.90    4.01
      0.08   1.68    3.81
Grab, transpose, and unpack the data as before, but then do
M-2 g f to use 2 lots of ordinates. This produces the following graph. 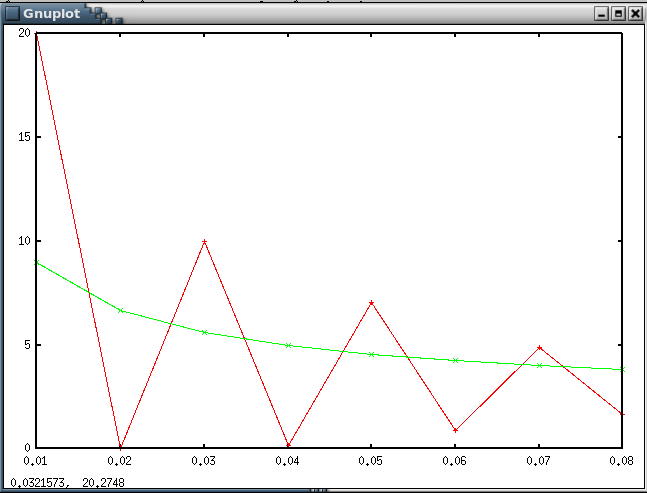 Similarly, for
n+1 columns of data representing n sets of ordinates,
hit
Similarly, for
n+1 columns of data representing n sets of ordinates,
hit M-n before calling
calc-graph-fast.
Calc is slow if the data sets are large.
valid XHTML
1.1
Last modified Tue. 15 Jan. 2008 by Geordie
McBain.